Case Study · 2026
Mobile App Development
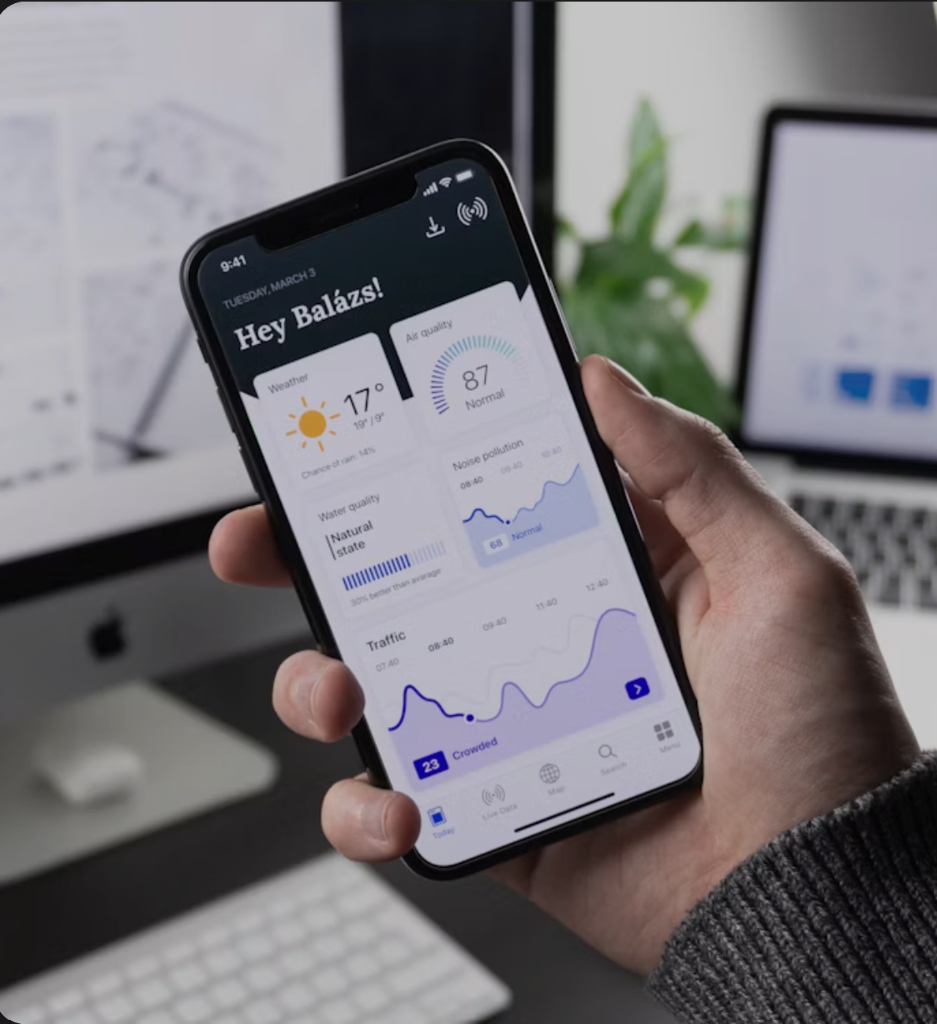
Reach your customers wherever they are with our top-tier mobile app development services. We create intuitive, engaging, and high-performance mobile applications for both iOS and Android platforms. Using technologies like React Native and Flutter, as well as native languages, we ensure a seamless user experience across all devices.
Context
A real-time analytics dashboard tracking and comparing product prices across countries to support logistics planning and pricing strategy — built in Power BI over REST APIs.
The Problem
The data existed; the decisions didn't. Multi-country price comparison lived in spreadsheets only an analyst could love — the design problem was making market intelligence legible to non-technical planners.
Process
KPI hierarchy before visuals
Decided what a planner must know in 5 seconds, 30 seconds and 5 minutes — the dashboard's three altitudes — before choosing a single chart.
Progressive filtering
Multi-dimensional filters that narrow from region to product without ever losing the comparison context.
Encodings for scanning, not studying
Comparisons as aligned bars and deltas, never pie charts; anomalies pre-surfaced instead of hunted for.
Design Decisions
Tiles before tables
The 5-second answer lives in KPI tiles; the evidence lives underneath. Most sessions never need the table — and that's the success case.
Comparison is the default view
No one opens a price tool to see one price. The first screen answers 'where is it cheaper, and by how much?'
Reflection
“Dashboard design is interface design with the hardest honesty requirement: every pixel either helps a decision or hides one.”